Using Analytics To Find Cheaters
I previously proposed CSGO analytics for evaluating reaction time and crosshair positions options. These player behavior features are interesting since CSGO players tend to accuse others of using wallhacks cheats when they have too perfect reactions or crosshair positioning. A too perfect reaction occurs when a player aims at an enemy before they become visible. A crosshair position is any angle where an enemy may appear. Players aim at locations where enemies will appear so they can react quickly. A too perfect crosshair position occurs when (1) a player has many crosshair position options since they are exposed to enemies possibly appearing from many angles, and (2) the player chooses the correct crosshair position for the one angle where an enemy will appear. Wallhacks, as shown in the video on the right, are cheats that show enemies through the wall. Since the player in the video can see the enemy's wireframe through the wall, they have too perfect crosshair positioning and react instantaneously with a headshot as soon as the enemy becomes visible.
I wanted to build an anti-cheat model based on this intuition that too perfect reaction times and crosshair positioning indicate cheating. The goal of the model was to group players into three cohorts.
- Pros: Near-instantaneous reaction times due to few crosshair position options. Pros limit the number of crosshair position options by standing in locations where enemies can only appear from a few angles. Since there are few crosshair position options, it's easier for pros to guess the correct one where an enemy will appear and react to the enemy as soon as they become visible.
- Hacking Amateurs: Negative reaction times even though there are many crosshair position options. Cheaters rely on their wallhacks to pick the correct crosshair position and aim at enemies through walls before the enemies become visible. This reliance on wallhacks means cheaters leave themselves exposed to (and ignore) many crosshair position options, since they know no enemies will appear at those positions.
- Legit Amateurs: Slow, positive reaction times due to many crosshair position options. Non-cheating amateurs leave themselves exposed to enemies from many angles. Therefore, they don't know where to position their crosshair and have slow reactions.
Reaction Time Feature Was Promising, Crosshair Position Feature Was Not
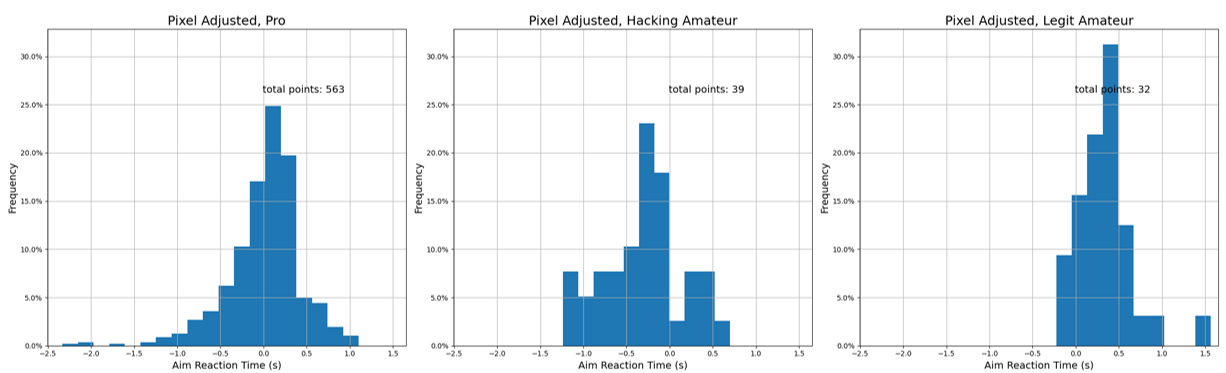
The pros, hacking amateurs, and legit amateurs had reaction times that matched my expectations. The below charts show that the pros have near-instantaneous reactions, the hacking amateurs have negative reactions, and the legit amateurs have slow reactions. I measured the average reaction times of players over a three-round interval. I measured two types of reactions: (1) the time from when an enemy becomes visible until the player's crosshair is on the enemy and (2) the time from when an enemy becomes visible until the player shot the enemy. The below charts list Aim Reaction Time (s) on the X axis because they use definition (1) based on crosshair aim. The titles all contain "Pixel Adjusted" because I'm using my pixel-accurate computation of visibility with an adjustment for network latency described in a prior blog post. The Y axis is the frequency of an three-round average reaction time. There is a lot more pro data than amateur data because I took the pro data from demos on HLTV and I generated the amateur data. I generated the amateur data so I could be certain who was and wasn't cheating.
I didn't produce blog-worthy charts for my crosshair positions analytics because it was less successful. I first computed the number of possible crosshair positions during each reaction. Then, I averaged the number of crosshair positions over the same three-round interval as above. I found that all players had roughly the same average. Future work might look more into this feature by examining outliers rather than averages, but I don't think that approach will be successful. Legit players can ignore many crosshair positions due to the game's context. I'll provide an example below of this position-eliminating context.
Model Performance Was Uninspiring
I trained a logistic regression model using these analytics as features. I accounted for reaction time by using three-round min, max, and average reaction times. The model received these values for both the aim and shooting reaction definitions. I accounted for crosshair positions by using the average number of crosshair positions over a three-round interval.
The ROC curves on the right shows that the model was not good enough. The ROC curves show the relationship between the true positive rate (TPR, the percent of cheaters detected) and the false positive rate (FPR, the percent of non-cheaters accused of cheating). The solid curves are results from different k-fold cross-validation iterations. The farther right on a curve, the more aggressive the cheating accusations. Based on the mean curve, the model could catch ~70% of cheaters with no false positives, but catching ~90% percent of the cheaters required a 50% false positive rate. I can't report 50% of legit players as cheating.
Please note that these results aren't indicative of real-world performance. I generated this data set by playing games with my friends. I used r_drawOtherModels 2 for the hacking games and r_drawOtherModels 0 for the legit games. The data set has a balanced number of hacking and non-hacking games. Real-world performance will be worse since (1) cheaters are far less common than non-cheaters, exacerbating the false positive problem; and (2) real cheaters will try harder to hide their cheats.
The Model Failed Due To Lack of Context
The model failed because it didn't account for a game's context. The video on the right shows a situation where I didn't cheat, but I had a cheater-like negative reaction time. I used the game's context to infer that the enemies could only come from one angle, and I positioned my crosshair at that angle. Since my crosshair position was slightly imprecise, I aimed at the wall rather than the space next to the wall. This resulted in my crosshair pointing at the enemy before they became visible.
I could keep adding more analytics that account for context, like footsteps and enemy spawn locations. However, I don't think this approach will work. Similar to the crosshair position feature, each situation is so specialized that these numbers just reflect the average behavior rather than a specific situation.
Comparing To A Bot's Playstyle May Help
My next step is to create human-like CSGO bots. If these bots can play CSGO like humans, then they'll need to account for the game's context. I can create hacking and legit bots and compare players' behaviors to these bots. If a player is most similar to a hacking bot, then they're probably hacking. This comparative approach will enable me to analyze behavior and handle game context without a mess of analytics.
If you have questions or comments about this analysis, please email me at durst@stanford.edu.